
I have been seeing these charts (first in photo magazines) for well over three decades and to this day I still don't know what they mean. I have never in my life bought a lens based on a chart on a graph.I always have to give myself a refresh on reading these charts. If I understand the numbers are how many lines per millimeter on the test image, the 10 trying to measure contrast, the 30 resolution. The S and M are the direction of the test lines and the x axis is center of the lens on the left moving to edges on the right.
You are using an out of date browser. It may not display this or other websites correctly.
You should upgrade or use an alternative browser.
You should upgrade or use an alternative browser.
What makes a Nikon lens an S lens?
- Thread starter David Bostock
- Start date
If you would like to post, you'll need to register. Note that if you have a BCG store account, you'll need a new, separate account here (we keep the two sites separate for security purposes).
Agreed! As lenses and cameras have become technically amazing for sharpness, clarity etc.. I had to chuckle a little as new versions of Light Room Classic introduced adjustments to add grain, produce lens blur etc.. I have had technically near perfect images that did not fare as well in sales (when I was still doing retail displays) or competitions as those that were not but they piqued a viewers interest.Typically the manufacturers publish MTFs at Wide and Tele for zooms and wide open for all lenses. But you're 100% correct, there is so much more to lens than sharpness.
Personally, I'm finding that my best photos (ie those that sell most products for my clients) are not necessarily the sharpest. I think that for the past ten years lens makers have been overly obsessed with sharpness and removal of all distortion and lenses today produce very sterile images.
I have been seeing these charts (first in photo magazines) for well over three decades and to this day I still don't know what they mean. I have never in my life bought a lens based on a chart on a graph.
This was a pretty good explanation. The article agrees with you that there are limits to the real world usefulness of the graphs.
Reading and Understanding Lens MTF Charts | Canon U.S.A., Inc.
Reading and understanding lens MTF charts. Dive into the world of photography and explore Canon's collection of educational articles to inspire your creativity.
 www.usa.canon.com
Last edited:
DGS
New member
In addition to what others have said I think that S line lenses also have better weather sealing.Hello All,
New guy here. I’m David Bostock from Portland, Oregon. I’ve been a long-time photographer starting out with Canon film cameras, then Canon digital. I switched to Fujifilm in 2018. After having nothing but problems with Fujifilm’s autofocus and subject detection, I sold it all in July and picked up the Nikon Z 8 and a few lenses. The new gear is fantastic; I wish I’d made the switch sooner. I do landscape, macro, and wildlife, mostly birds. Steve’s Nikon Z8 and Z9 Wildlife Setup Guide and Secrets to Stunning Bird-in-Flight Photography were fantastic in getting me up to speed quickly. Thank you Steve.
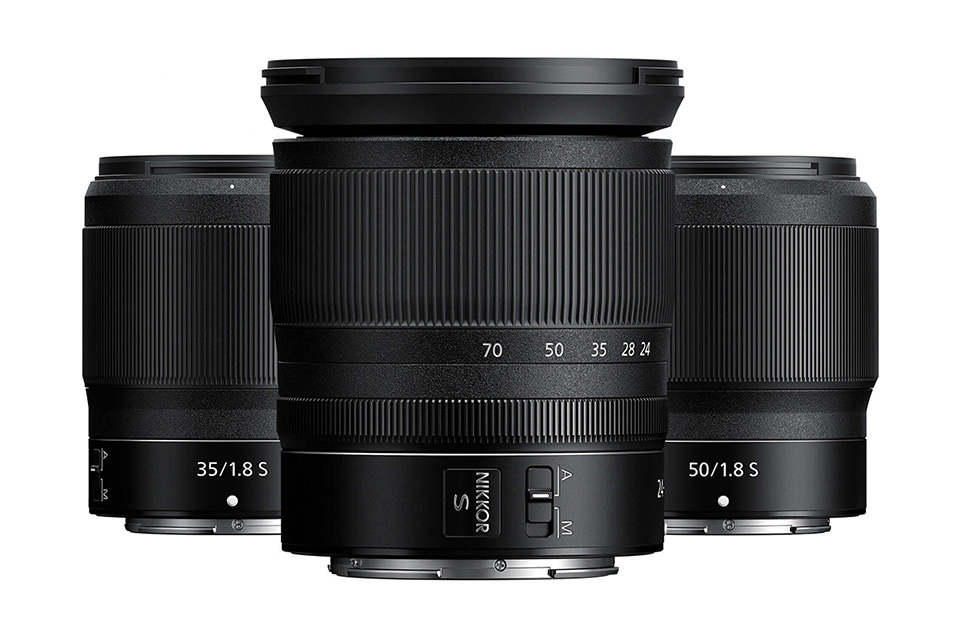
I got the Z 180-600mm for wildlife and really like it. All my other lenses are Nikon Z S lenses. So, what makes a Nikon lens an S lens? Just curious…
Looking forward to participating on these forums.
Cheers,
David
Eric, thanks for the information. Much appreciated.I saw that explanation from the CoolBlue site. I don't know where they got that idea - maybe AI gone wrong. It's simply not correct.
Nikon indicates the S represents a class of lenses that is superior - although they don't use the term explicitly as Superior. The lenses have design characteristics that can include better edge to edge sharpness, the ability to use them wide open, better bokeh, reduced color fringing, and weather sealing. Quality control standards are higher on S lenses. While they usually have less distortion, that can include corrected distortion. S lenses are normally designed with less focus breathing. Focus motors are silent or near silent which is important for video. The specific emphasis of a given lens depends on how those characteristics are balanced, so you might have a lens that emphasizes one characteristic a bit more. Optical coatings include more coatings and improved coatings compared to non-S alternatives. Pricing of S lenses is a bit higher, while non-S lenses are available at lower price points.
They are not slim lenses, they don't have anything to do with lens size, they are not professional lenses per se, and they are not distortion free. There are sharper and less sharp S lenses. Lenses designed for small size or lower price points are in almost all cases not S lenses, so none of the compact primes, DX lenses, or less expensive telezooms are S lenses. That does not make them bad lenses - but there may be limitations not found with S lenses. I own four non-S lenses - the 25-50mm DX, 50-250mm DX, 26mm f/2.8, and 50mm MC. All of these are included as eligible lenses in the gear list for NPS membership.
Here are a couple of links from Nikon sites:
S line: A Badge of Honor for NIKKOR Z Lenses
Nikon's Chris Ogonek discusses the high quality of Nikon S line NIKKOR Z lenses.www.nikonusa.com
NIKKOR S lenses – what makes them different?
Glass for the Nikon Z mount come in two flavours, so what is it about the pro-level S line that sets them apart?www.nikon.es
Here is another reference from a reliable source:
Everything You Need to Know About Nikon Z Lenses
photographylife.com
Thanks to all for your input too.
Cheers,
David
Did a shoot last night with the 50 and 85 1.2s. Can confirm S does not stand for slim.
Did a shoot last night with the 50 and 85 1.2s. Can confirm S does not stand for slim.
